Bitter-sweet
Changing global cereal prices are expected to influence FMCG product prices directly.

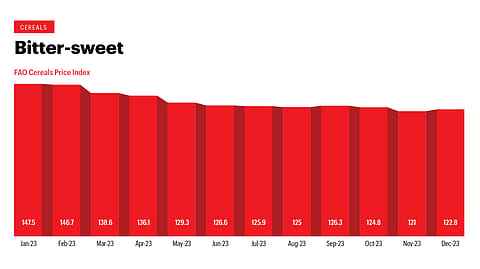
In December, the FAO Cereal Price Index reached an average of 122.8 points, an increase of 1.8 points (1.5%) from November but 24.4 points (16.6%) lower over that of December 2022. This shift contrasts with 2022’s steep price increase following Russia’s invasion of Ukraine, a significant grain exporter. Changing global cereal prices are expected to influence FMCG product prices directly. As a result, FMCG companies may experience reduced revenues owing to the decline in goods prices but margins may differ based on input costs.
Not Milky Enough
In 2023, international dairy product prices, as tracked by the FAO Dairy Price Index, recorded an average of 118.8 points, a fall of 23.6 points, or 16.6%, from the average index value in 2022. The downturn is attributed to a substantial drop in international prices of dairy commodities over the past few months. A similar trend is also being observed in India. As a result of declining prices of key products such as skimmed milk powder and dairy fats, many dairy companies in the country have responded by reducing prices at which they procure milk from farmers.
Not Quite Sugary
The Sugar Price Index rose by an average of 134.6 points in December, a significant decrease of 26.8 points (16.6%) from November — the lowest point in the past nine months. The sharp drop in international sugar prices in December was primarily due to a robust increase in production in Brazil, aided by favourable weather conditions. This boost in production led to profit-taking in the markets, subsequently leading to an adjustment in sugar prices. In parallel, India is shifting its focus towards increasing sugar production over ethanol this year, suggesting a potential rise in sugar output.